
If the statistical truism holds true that you can’t concede 50 points in a game and win the premiership, then the Warriors are now goners based on Sunday’s 66-6 rout on the Gold Coast.
But building a premiership-winning team comes down to more than simply ensuring you don’t have a half-century put on you in a game during the regular season.
Last year, The Roar crunched the numbers to determine the key performance indicators for a team to win the competition by the halfway mark of the season.
That analysis led to a hypothesis that only the Panthers, Broncos, Rabbitohs and Sharks were statistically likely to be the last team standing on Grand Final night.

(Photo by Chris Hyde/Getty Images)
Penrith and Brisbane ended up duking it out for the title with Ivan Cleary’s team notching a third straight premiership while the Sharks faded in the finals not for the first time and Souths fell off a cliff after sitting on top of the ladder at the halfway point of the 2003 season.
Turning our attention to this season, using the body of numerical evidence from the first 26 seasons of the NRL era, when the same 13 KPIs are applied, it shows five sides are genuine title hopes while the others need to defy the weight of history to get their hands on the Provan-Summons Trophy in October.
Using a process of elimination, here’s how the 17 contenders can be whittled down to five.
Key performance indicators for premiers
Lead-up form
The history books show that unless you made the finals the year before, you won’t win the comp with only Penrith in 2003, (who were 12th in 2002), the Wests Tigers two years later (ninth the previous season) and the Roosters of 2013 (up from 13th) defying that trend.
And 72% of premiers in the NRL era finished in the top four in the previous season.
When it comes to the halfway mark of the season, if you aren’t in the top eight, you are not in the race with only the ‘05 Tigers (11th) making a run to premiership glory from the bottom half of the standings.
If you don’t make the top four and get the all-important second chance, you have minimal hope in the playoffs with no team since the Bulldogs 29 years ago going all the way from the bottom half of the finals bracket.
| Year | Premiers | Previous season | Halfway mark of season | Regular season finish |
| 1998 | Broncos | Premiers | 5th | 1st |
| 1999 | Storm | 3rd | 3rd | 3rd |
| 2000 | Broncos | 8th | 1st | 1st |
| 2001 | Knights | 3rd | 1st | 3rd |
| 2002 | Roosters | 6th | 6th | 4th |
| 2003 | Panthers | 12th | 3rd | 1st |
| 2004 | Bulldogs | 3rd | 2nd | 2nd |
| 2005 | Tigers | 9th | 11th | 4th |
| 2006 | Broncos | 3rd | 1st | 3rd |
| 2007 | Storm* | Minor premiers | 1st | 1st |
| 2008 | Sea Eagles | 2nd | 1st | 2nd |
| 2009 | Storm* | Minor premiers | 6th | 4th |
| 2010 | Dragons | Minor premiers | 1st | 1st |
| 2011 | Sea Eagles | 8th | 3rd | 2nd |
| 2012 | Storm | Minor premiers | 1st | 2nd |
| 2013 | Roosters | 13th | 3rd | 1st |
| 2014 | Rabbitohs | 2nd | 5th | 3rd |
| 2015 | Cowboys | 5th | 2nd | 3rd |
| 2016 | Sharks | 6th | 1st | 3rd |
| 2017 | Storm | 2nd | 1st | 1st |
| 2018 | Roosters | 2nd | 7th | 1st |
| 2019 | Roosters | Premiers | 3rd | 2nd |
| 2020 | Storm | 2nd | 3rd | 2nd |
| 2021 | Panthers | 2nd | 1st | 2nd |
| 2022 | Panthers | Premiers | 1st | 1st |
| 2023 | Panthers | Premiers | 1st | 1st |
Storm’s 2007 and ’09 premierships were stripped after they had won the Grand Final for salary cap rorting
Attack and defence
Scoring points and stopping them is kinda important in the NRL.
Only three of the past 26 champion outfits didn’t finish in the top four for points scored – the 2002 Roosters (sixth), ‘06 Broncos (12th) and ‘10 Dragons (eighth).
On the defensive side, five teams have won the title after not being in the top four for points conceded – the 1999 Storm outfit, Newcastle (ninth) in 2001, the ‘03 Panthers (seventh), the ‘05 Tigers (10th) and the Cowboys (fifth) of 2015.
And it is true that if you concede 50 in the regular season, so those “once were” Warriors are looking shaky after their surrender to the Titans last weekend.
The top four attacking teams heading into this week’s Round 17 are the Cowboys (29.5), Raiders (25.7), Dolphins (25.2) and Broncos (24.7) while the best in defence are the Panthers (15.6), Bulldogs (16.9), Roosters (18.6) and Sharks (19.7).
| Year | Premiers | Rank in attack | Rank in defence | Highest score | Most points conceded |
| 1998 | Broncos | 1st | 1st | 60 | 28 |
| 1999 | Storm | 1st | 5th | 62 | 34 |
| 2000 | Broncos | 1st | 1st | 56 | 28 |
| 2001 | Knights | 2nd | 9th | 60 | 49 |
| 2002 | Roosters | 6th | 1st | 58 | 48 |
| 2003 | Panthers | 3rd | 7th | 52 | 42 |
| 2004 | Bulldogs | 1st | 3rd | 54 | 40 |
| 2005 | Tigers | 2nd | 10th | 54 | 44 |
| 2006 | Broncos | 12th | 1st | 50 | 36 |
| 2007 | Storm* | 1st | 1st | 58 | 30 |
| 2008 | Sea Eagles | 1st | 2nd | 52 | 40 |
| 2009 | Storm* | 11th | 2nd | 48 | 26 |
| 2010 | Dragons | 8th | 1st | 38 | 32 |
| 2011 | Sea Eagles | 1st | 2nd | 42 | 32 |
| 2012 | Storm | 2nd | 1st | 46 | 40 |
| 2013 | Roosters | 1st | 1st | 56 | 32 |
| 2014 | Rabbitohs | 3rd | 1st | 50 | 30 |
| 2015 | Cowboys | 2nd | 5th | 50 | 44 |
| 2016 | Sharks | 3rd | 2nd | 62 | 32 |
| 2017 | Storm | 1st | 1st | 64 | 38 |
| 2018 | Roosters | 4th | 1st | 56 | 30 |
| 2019 | Roosters | 2nd | 2nd | 58 | 38 |
| 2020 | Storm | 3rd | 2nd | 50 | 30 |
| 2021 | Panthers | 4th | 1st | 56 | 37 |
| 2022 | Panthers | 1st | 1st | 46 | 38 |
| 2023 | Panthers | 1st | 1st | 53 | 32 |
For and against
You have to finish at least 100 points to the good at the end of the regular season or historically, you are not in the hunt.
So that means current finals contenders like the eighth-placed Cowboys (-8), Dragons (-50), Raiders (-79) and Warriors (-47) need to fix that up quick smart while the Sea Eagles(+28) are not as bad as their 11th placing would suggest.
| Year | Premiers | F&A differential |
| 1998 | Broncos | 378 |
| 1999 | Storm | 392 |
| 2000 | Broncos | 308 |
| 2001 | Knights | 143 |
| 2002 | Roosters | 216 |
| 2003 | Panthers | 132 |
| 2004 | Bulldogs | 269 |
| 2005 | Tigers | 101 |
| 2006 | Broncos | 105 |
| 2007 | Storm* | 277 |
| 2008 | Sea Eagles | 290 |
| 2009 | Storm* | 157 |
| 2010 | Dragons | 219 |
| 2011 | Sea Eagles | 208 |
| 2012 | Storm | 218 |
| 2013 | Roosters | 315 |
| 2014 | Rabbitohs | 224 |
| 2015 | Cowboys | 133 |
| 2016 | Sharks | 176 |
| 2017 | Storm | 297 |
| 2018 | Roosters | 181 |
| 2019 | Roosters | 264 |
| 2020 | Storm | 258 |
| 2021 | Panthers | 286 |
| 2022 | Panthers | 306 |
| 2023 | Panthers | 333 |
Home and away record
The benchmark is eight wins during the regular season with only Souths in 2014 with a 7-5 record having a home record below that.
And all the legit premiers in the NRL era won at least half of their road games.
The Bulldogs are the worst of the current top eight for away fixtures with a 1-7 record but they are unbeaten from six home starts.
Brisbane are 3-4 heading into Saturday’s trip to Auckland to face the Warriors.
| Year | Premiers | Home record | Away record |
| 1998 | Broncos | 10-2 | 8-3 |
| 1999 | Storm | 9-3 | 7-5 |
| 2000 | Broncos | 12-0 | 6-6 |
| 2001 | Knights | 9-4 | 7-5 |
| 2002 | Roosters | 8-3 | 7-5 |
| 2003 | Panthers | 8-4 | 10-2 |
| 2004 | Bulldogs | 11-1 | 8-4 |
| 2005 | Tigers | 8-4 | 6-6 |
| 2006 | Broncos | 8-4 | 6-6 |
| 2007 | Storm* | 12-0 | 9-3 |
| 2008 | Sea Eagles | 9-3 | 8-4 |
| 2009 | Storm* | 9-2 | 5-7 |
| 2010 | Dragons | 9-3 | 8-4 |
| 2011 | Sea Eagles | 11-1 | 7-5 |
| 2012 | Storm | 9-3 | 8-4 |
| 2013 | Roosters | 8-4 | 10-2 |
| 2014 | Rabbitohs | 7-5 | 8-4 |
| 2015 | Cowboys | 8-4 | 9-3 |
| 2016 | Sharks | 11-1 | 6-5 |
| 2017 | Storm | 9-3 | 11-1 |
| 2018 | Roosters | 8-4 | 8-4 |
| 2019 | Roosters | 9-3 | 8-4 |
| 2020 | Storm | 9-1 | 7-3 |
| 2021 | Panthers | 12-0 | 9-3 |
| 2022 | Panthers | 10-2 | 10-2 |
| 2023 | Panthers | 9-3 | 9-3 |
Origin reps, coach’s experience, goal-kicking?
For Origin representation, like superannuation ads, past performance is not a reliable indicator of future results because the Warriors rarely have as many eligible players as the other sides.
On average, the premiers have just under five Origin reps that season but it is not essential with the Panthers and Tigers premiers from early in the century going unrepresented in the interstate fixtures when they won.
Penrith had six last year and seven the two previous seasons of their current three-peat. They have only had five this time around but that is possibly due to Nathan Cleary being injured.
The average experience for a coach is 10.03.
So it’s best to have a coach who has a decade’s worth of scars from the NRL battleground with Wayne Bennett, Craig Bellamy and more recently Ivan Cleary the main reason for that number being so high.
Elite goal-kicking is important but not a total must-have. Only once in the past 11 years has a premiership-winning team struck at below 75%, the 2016 Sharks (73.6). The Panthers and Storm this decade have all been above 80%.
| Year | Premiers | Origin reps | Coach experience | Goal-kicking % |
| 1998 | Broncos | 11 | 12th season | 67.9 |
| 1999 | Storm | 4 | 10th season | 62.9 |
| 2000 | Broncos | 7 | 14th season | 72.7 |
| 2001 | Knights | 4 | 1st season | 80.6 |
| 2002 | Roosters | 3 | 1st season | 76.7 |
| 2003 | Panthers | 0 | 10th season | 70 |
| 2004 | Bulldogs | 5 | 7th season | 83.2 |
| 2005 | Tigers | 0 | 21st season | 81.6 |
| 2006 | Broncos | 9 | 20th season | 71.2 |
| 2007 | Storm* | 7 | 5th season | 69.2 |
| 2008 | Sea Eagles | 1 | 5th season | 67.3 |
| 2009 | Storm* | 6 | 7th season | 71.5 |
| 2010 | Dragons | 7 | 24th season | 74 |
| 2011 | Sea Eagles | 4 | 8th season | 70.5 |
| 2012 | Storm | 4 | 10th season | 70.9 |
| 2013 | Roosters | 4 | 1st season | 84.1 |
| 2014 | Rabbitohs | 3 | 3rd season | 79.1 |
| 2015 | Cowboys | 4 | 2nd season | 75.6 |
| 2016 | Sharks | 4 | 6th season | 73.6 |
| 2017 | Storm | 6 | 15th season | 75.4 |
| 2018 | Roosters | 3 | 6th season | 74.8 |
| 2019 | Roosters | 3 | 7th season | 75.2 |
| 2020 | Storm | 6 | 18th season | 86.2 |
| 2021 | Panthers | 7 | 15th season | 82 |
| 2022 | Panthers | 7 | 16th season | 83.6 |
| 2023 | Panthers | 6 | 1th season | 80.7 |
Via process of elimination, who is in the 2024 hunt?
Applying these historical factors to the current premiership race, who are contenders and who are pretenders?
If nobody has won the comp from 13th or lower the previous year, that means the Dolphins, Titans, Bulldogs, Dragons and Wests Tigers won’t be the last team standing in 2024.
Storm Panthers Sharks Roosters Dolphins Bulldogs Broncos Cowboys Dragons Raiders Sea Eagles Knights Warriors Rabbitohs Titans Tigers Eels
If you are 12th or lower at the halfway point of the season, that also rules you out. Using Round 14 as the mid-point of the 27-week season as it is the point at which all teams have played half their matches, that means the Cowboys, Knights, Eels and Rabbitohs are also off the list of legit contenders.
Storm Panthers Sharks Roosters Dolphins Bulldogs Broncos Cowboys Dragons Raiders Sea Eagles Knights Warriors Rabbitohs Titans Tigers Eels
Premiership-winning teams can’t be ranked below 12th in attack so that means on current form that the Knights, Tigers, Dogs, Dragons, Bunnies and Titans are goners but they are already ruled out of the running.
Storm Panthers Sharks Roosters Dolphins Bulldogs Broncos Cowboys Dragons Raiders Sea Eagles Knights Warriors Rabbitohs Titans Tigers Eels
Defensively, teams need to be in the top 10 so heading into this round, that means the axe will fall so that means the Raiders (14th overall) are on the chopping block but the Warriors (10th) just survive.
Storm Panthers Sharks Roosters Dolphins Bulldogs Broncos Cowboys Dragons Raiders Sea Eagles Knights Warriors Rabbitohs Titans Tigers Eels
Now to the nitty gritty for the seven remaining contenders.
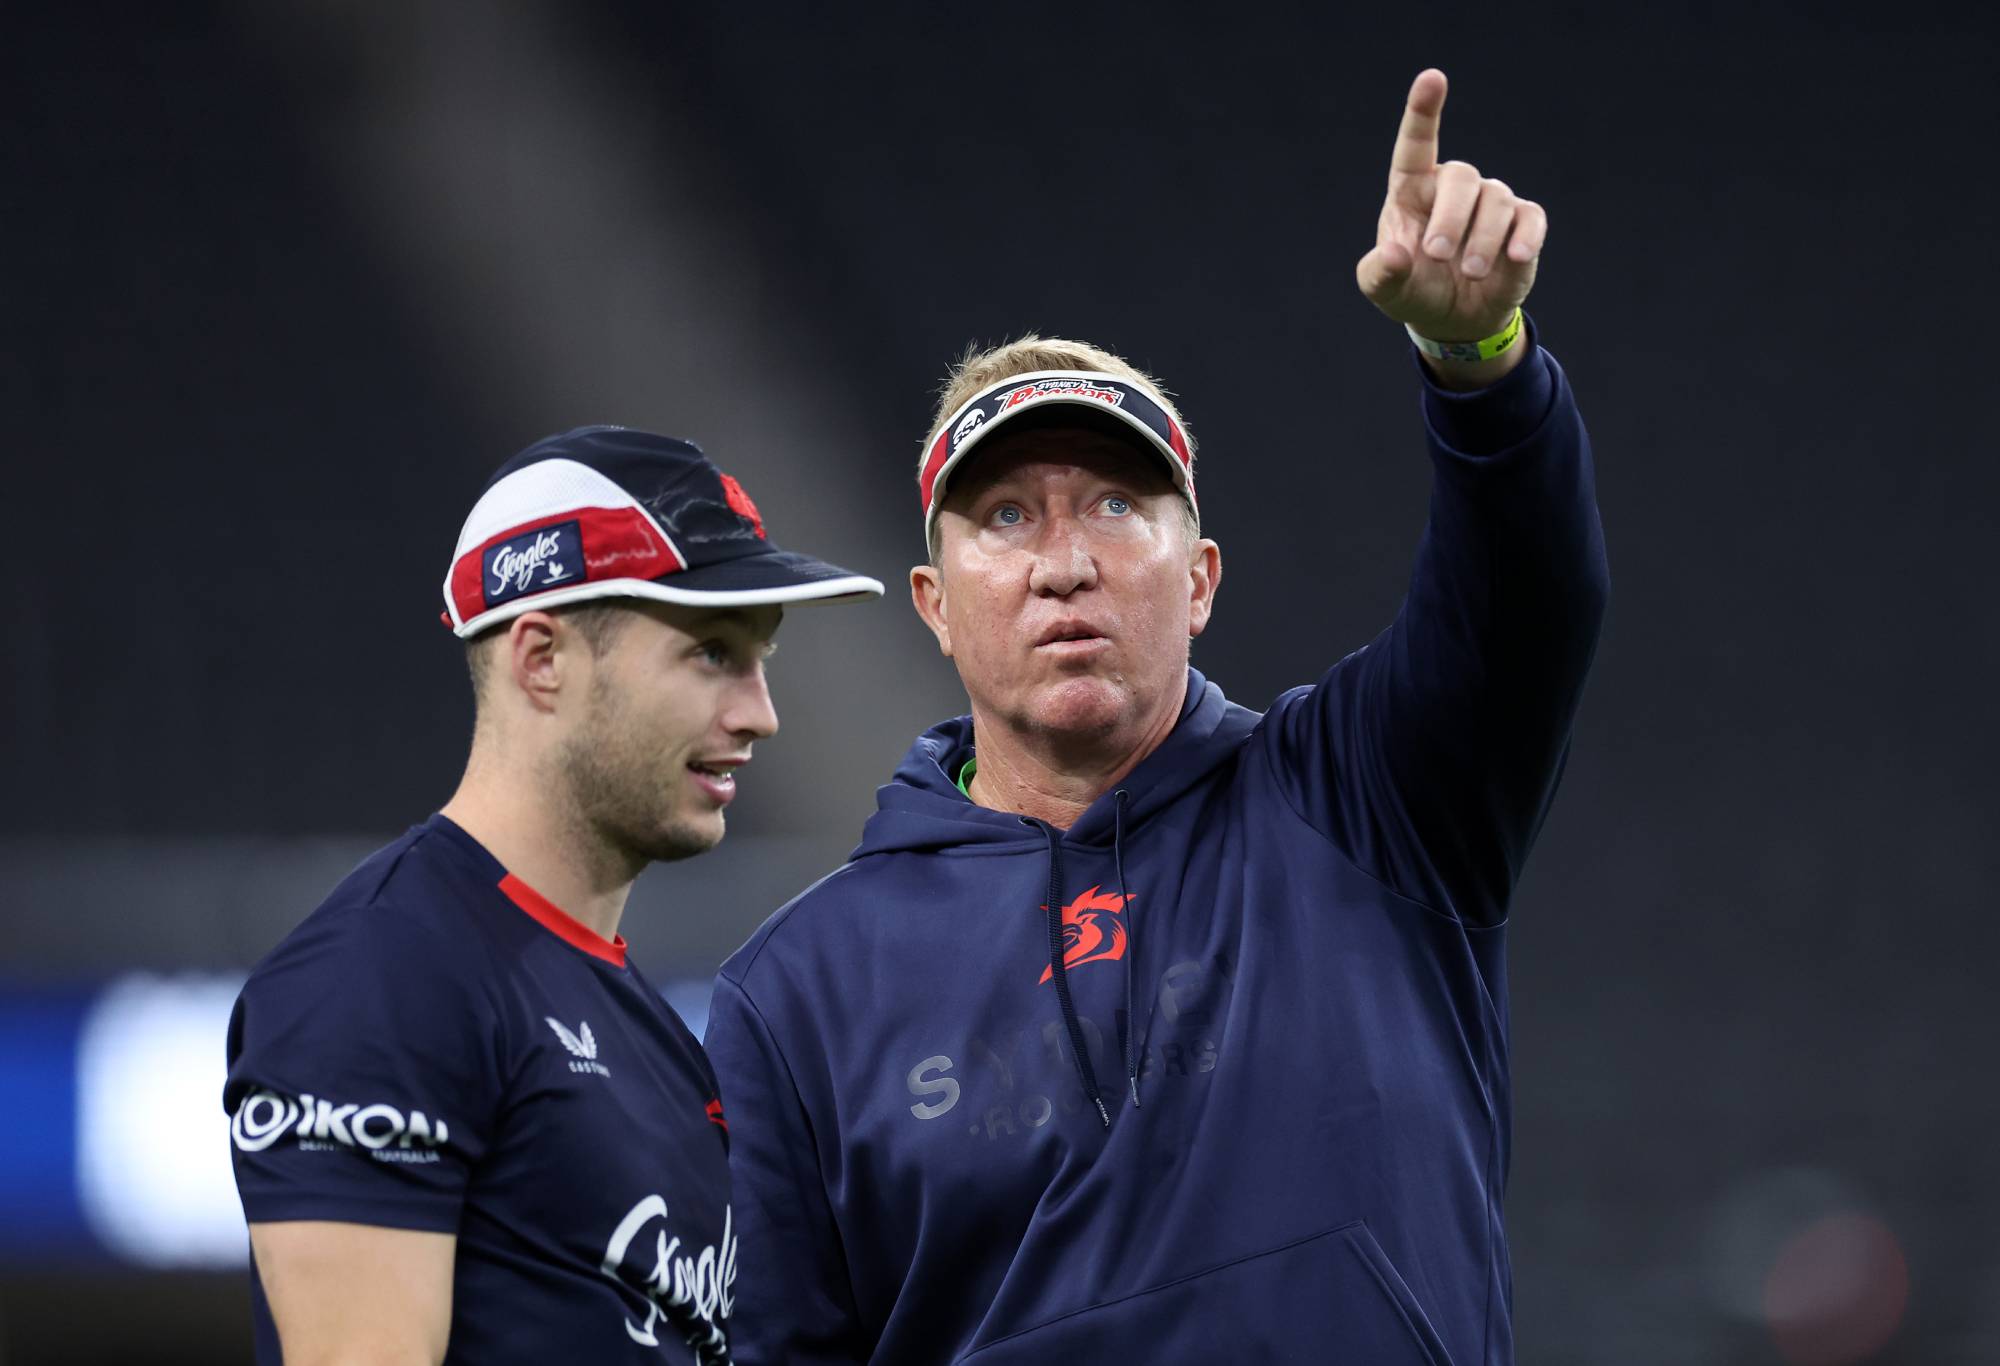
Roosters coach Trent Robinson talks with Sam Walker. (Photo by Ezra Shaw/Getty Images)
All premiership-winning teams in the NRL era have scored at least 38 points in a game – the Storm (54), Panthers (42 – twice), Sharks (three times with a peak of 42), Roosters (three times with a peak of 60), Broncos (38, once) and Warriors (42) have done so but the Sea Eagles have topped out at 36 despite reaching the 30s on five occasions.
Storm Panthers Sharks Roosters Dolphins Bulldogs Broncos Cowboys Dragons Raiders Sea Eagles Knights Warriors Rabbitohs Titans Tigers Eels
And now the Warriors finally get culled on the old “have you conceded 50 in a game” litmus test.
Storm Panthers Sharks Roosters Dolphins Bulldogs Broncos Cowboys Dragons Raiders Sea Eagles Knights Warriors Rabbitohs Titans Tigers Eels
Using overall for and against, these five are all capable of reaching triple figures but Brisbane are no certainty at +37 after 14 matches. The Storm (103), Panthers (118) and Roosters (161) are already at that point while the Sharks (78) are well on track.
Storm Panthers Sharks Roosters Dolphins Bulldogs Broncos Cowboys Dragons Raiders Sea Eagles Knights Warriors Rabbitohs Titans Tigers Eels
If you consider Origin reps to be a strong indicator, the Roosters (six) and Panthers (five) have the edge on that front, coaching experience also points to Trent Robinson (12th year) and Cleary (18th) with Bellamy (23rd) the clear leader while when it comes to goal-kicking, Cronulla (88%) and Brisbane (85%) are the best of this bunch.
So it’s a traditional final five in 2024 when it comes to the teams with a shot at adding to their trophy cabinet.
And it’s no surprise that these five teams occupy the top rungs of the betting odds with no other team rated better than a 25-1 shot and Penrith ($2.80) the overwhelming favourites to make it four titles on the trot.
New Zealand Warriors
v
Brisbane Broncos
NRL : Head To Head
Sat, 29 Jun 2024, 15:00
Newcastle Knights
v
Parramatta Eels
NRL : Head To Head
Sat, 29 Jun 2024, 17:30
Melbourne Storm
v
Canberra Raiders
NRL : Head To Head
Sat, 29 Jun 2024, 19:35
St. George Illawarra Dragons
v
Dolphins
NRL : Head To Head
Sun, 30 Jun 2024, 14:00
Penrith Panthers
v
North Queensland Cowboys
NRL : Head To Head
Sun, 30 Jun 2024, 16:05
Sydney Roosters
v
Wests Tigers
NRL : Head To Head
Sun, 30 Jun 2024, 18:15
* Odds Correct At Time Of Posting. Check PlayUp Website For Latest Odds
Imagine what you could be buying instead.
For free and confidential support call 1800 858 858 or visit gamblinghelponline.org.au
Brisbane certainly showed last year on Grand Final night that they have the firepower to upset the Panthers but have been nowhere near their best this season, which can’t just be attributed to Adam Reynolds’ long-term arm injury.
Melbourne have been ultra consistent but have also not quite hit top gear and their title hopes will hinge on how Cameron Munster performs when he returns from a groin tear next month.
Cronulla have hit the mid-season wobbles after a strong start to the year and their 42-0 flogging at the hands of Penrith last month only exacerbated the theory that they are not quite in the upper echelon of the elite teams.
The Roosters are rising up the pecking order nicely after an up-and-down start to their campaign – they have a lot of moving pieces on their roster heading into the off-season but if Sam Walker can continue his exponential progression as a playmaker, they are shaping as the main challengers to the Panthers’ status as the kings of the NRL jungle.